
Evolution of the carbon footprint
What is the carbon footprint?
The carbon footprint of an organization is the total amount of greenhouse gases emitted directly or indirectly through its activities. It is a crucial tool for assessing the environmental impact of human activities.
In the case of the Universitat Politècnica de València (UPV), this analysis is fundamental due to its size and influence on the environment.
How is it calculated?
The carbon footprint of each emission source is calculated by multiplying the consumption (or activity) data by its corresponding emission factor.
- Activity data represents the level of activity that generates emissions, such as the amount of natural gas used for heating.
- The emission factor indicates the amount of greenhouse gases emitted per unit of activity, e.g. 0.182 kg CO2 equivalent per kWh of natural gas
Commitments
2014
The UPV registers its carbon footprint in the Ministry of Ecological Transition and the Demographic Challenge.
2019
Adherence to the global initiative of higher education institutions on the state of climate emergency with the goal of achieving a “carbon neutral” university by 2050.
2022
Signing of the protocol “Valencia climate neutral city in 2030” by the UPV and the Valencia City Council.
Approval of the strategic objective “OSOS1: Positioning the UPV so that its 3 campuses achieve carbon neutrality by 2030” included in the UPV Strategic Plan 2023-2027 SIRVE.
Methodology
In order to facilitate the detection of direct and indirect greenhouse gas (GHG) emissions, three scopes have been defined

Scope 1
Direct emissions
- Consumption of fuels in buildings (natural gas boilers, diesel, etc.).
- Leaks of fluorinated gases in air-conditioning / refrigeration equipment.
- Vehicle fuel consumption.
Scope 2
Indirect emissions from electricity consumption
- Electricity consumption in buildings.


Scope 3
Other indirect emissions
- Business travel with external means of transportation.
- Outsourced services (waste management, cleaning, security, etc.).
- Purchase of products.
Registration
Since 2014, the UPV has been recording its carbon footprint in the Ministry of Ecological Transition and the Demographic Challenge according to Royal Decree 163/2014, of March 14, creating the. Carbon footprint registry, offset and carbon dioxide absorption projects. This registry, of a voluntary nature, was created with the aim of encouraging the calculation and reduction of the carbon footprint by Spanish organizations, as well as to promote projects that improve the drainign capacity of Spain, constituting therefore a measure to combat climate change horizontally.
1. Carbon Footprint Registration
- Use of an organization’s Carbon Footprint calculator. Scope 1+2 provided by the Ministry.
- Follow-up of the indications provided by the Ministry of Ecological Transition and the Demographic Challenge.
2. Developement of the Reduction Plan and follow-up reports.
- Development of a plan that includes measures to reduce the Carbon Footprint.
- Incorporation of actions proposed for the previous year and establishment of reduction targets for the following year.
3. Carbon Footprint Verification
- Periodic verification process through the EMAS environmental management seal.
- Assurance of the validity of the data and calculations recorded through periodic audits.
Results
Below is the evolution and distribution of the UPV’s carbon footprint by scopes (1 and 2) and by years. These graphs allow us to visualize and be aware of the contribution to climate change generated by the activity of the UPV. It should be noted that the evolution of the carbon footprint associated with scope 3 is not shown because the calculation methodology for this scope is relatively recent and data is only available for the year 2022;
Each year leaves its mark
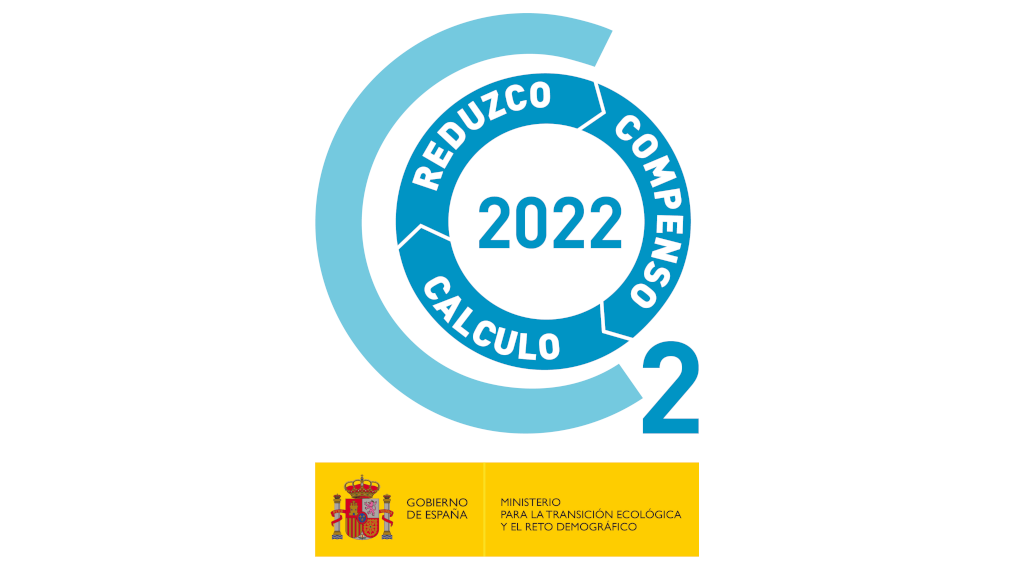
2022
The Carbon Footprint for 2022 has been reduced by 12.13% compared to 2021. This year the “I calculate, reduce and compensate” seal has been obtained, due to the fact that a reduction of 6.30% of the average emission intensity in the three-year period 2020-2022 has been observed and 6 tCO2 eq through a restoration project in the municipality of Gátova.
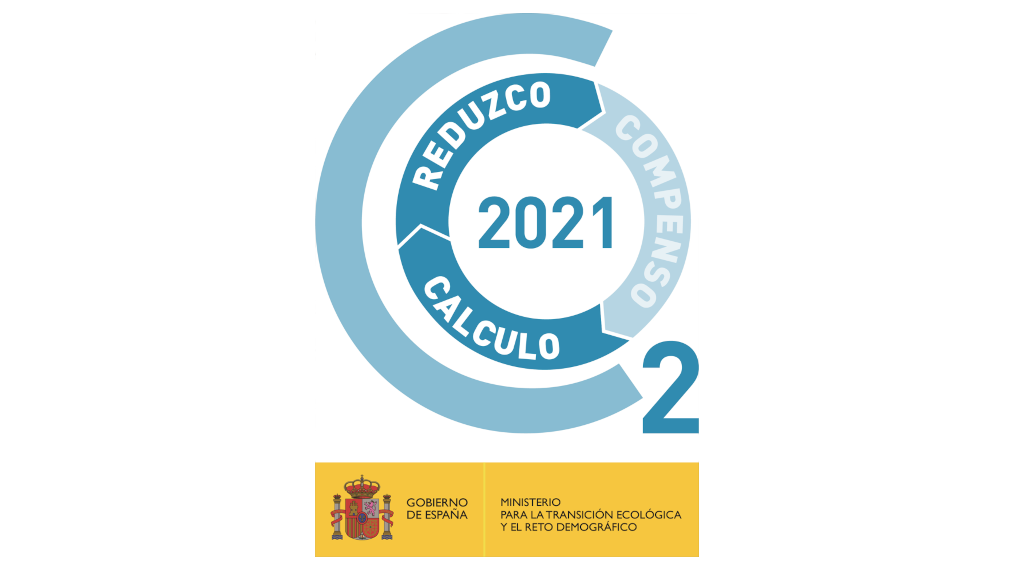
2021
The 2021 Carbon Footprint has increased by 101.12% over the previous year. This is due to the fact that university activity in 2020 was greatly reduced due to the COVID-19 pandemic. It should be noted that if we compare it with respect to 2019, the 2021 Carbon Footprint was reduced by 3.68%.
2020
The 2020 Carbon Footprint has been reduced by 52.11% compared to 2019. The reduction in this year’s carbon footprint, is due to the low university activity during the year caused by the COVID-19 pandemic.

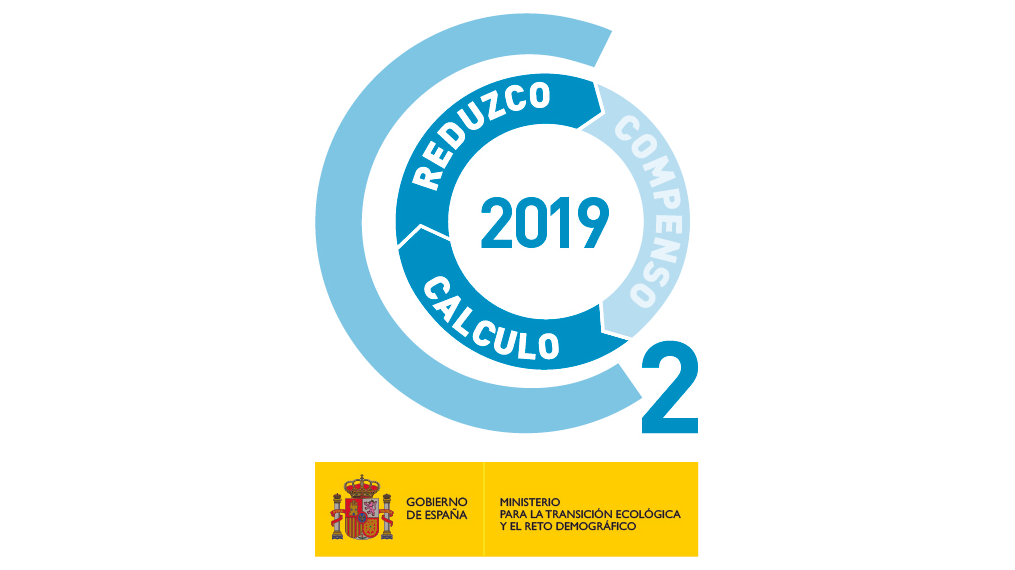
2019
The 2019 Carbon Footprint has been reduced by 66.74% compared to 2018. This reduction is mainly due to the fact that, as of this year, the electricity is of guaranteed renewable origin, so the carbon footprint of Scope 2 becomes 0.
Documents of interest
- No downloads found.