This page shows the progress of the first year of the technicians contracted under the Investigo program under the responsibility of the Vice-Rectorate of Sustainable Development of the Campus.
ENERGY TRANSITION: Energy Efficiency of UPV buildings
Aaron Jara Calabuig
During the contract’s first year, research on the energy efficiency of existing buildings, especially university buildings, has been addressed. To this end, plans, studies and guidelines developed by other Spanish and foreign universities that have already implemented energy-saving strategies on their campuses have been analyzed. In parallel, a mapping of the energy ratings of UPV buildings has been carried out according to the energy efficiency certificates in force, which allows the identification of those buildings on which it is a priority to intervene.
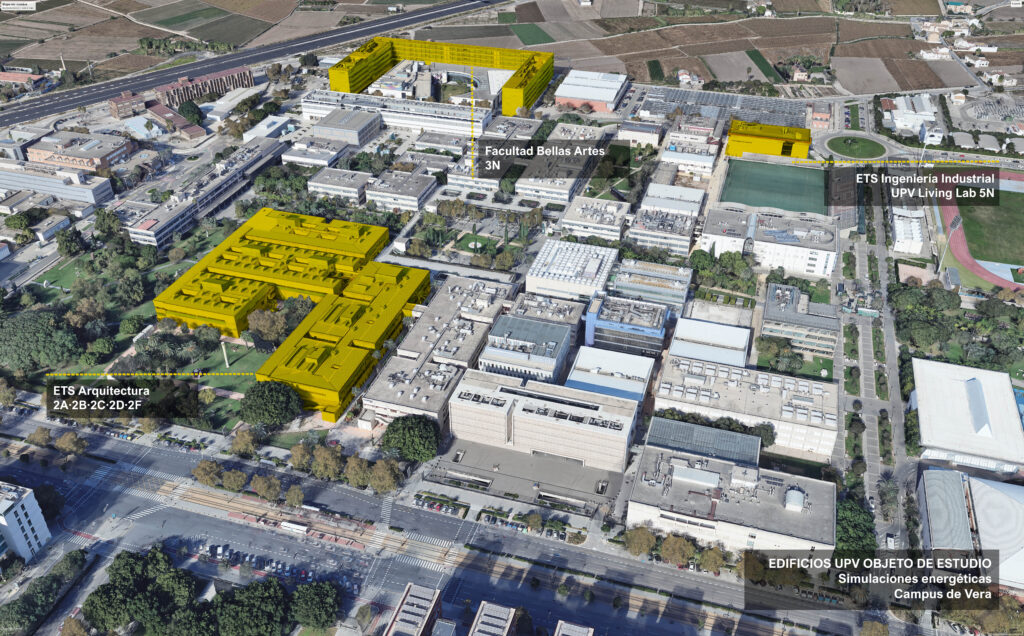
On the other hand, a methodology has been developed for the realization of energy simulations, a procedure through which specialized software is used to model and evaluate the energy performance of the buildings of the three campuses. In this way, it has been possible to assess the energy efficiency actions to be developed and their contribution to the energy transition of the institution. Specifically, work has been carried out on buildings 5N (School of Industrial Engineering – ETSII UPV Living Lab), 3N (Faculty of Fine Arts – FBBAA) and 2A, 2B, 2C, 2D and 2F (School of Architecture – ETSA), located on the Vera campus. Recently, in situ comfort measurements have begun in different areas of the ETSA to complete the diagnosis and propose improvements for future interventions.
Continuous training is a critical factor in the achievement of objectives. For this reason, different courses and specialization days have been attended, among which the monograph on Energy audit of buildings(Institut Valencià de l’Edificació), the Seminar on the new European regulatory frameworks for sustainability in construction (Green Building Council España i Col-legi Territorial d’Arquitectes de València), the course of Introduction to Geographic Information Systems using QGIS (UPV) i el Energy rehabilitation training program in pilot cities – València (Project URBANEW: Ajuntament de València i CESEFOR).
RESULTS OBTAINED
So far, the energy simulations have allowed the selection of strategic actions related to the energy rehabilitation of the following buildings. In the case of 5N, proposals aimed at reducing the energy demand for heating and cooling are proposed, focused on replacing glass and fuses of the enclosed buildings and the solar protection of the curtain walls. Regarding 3N, work is being carried out on a project to integrate photovoltaic solar panels on the southwest façade to generate energy and, at the same time, provide solar protection for the enclosed walls that make up the curtain wall. The results of this project will be presented at the 19th Conference on Sustainable Development of Energy, Water and Environment Systems(SDEWES), which will take place in Rome (Italy) in September 2024.
Regarding buildings 2A, 2B, 2C, 2D and 2F, improvements in the thermal envelope insulation are proposed, which could replace the current roofing solution. It also contemplated the intervention on the walls by replacing the window frames and glass of the windows, as well as solar protection by creating seasonal shading. In addition, other solutions focused on green infrastructure, such as planting new trees near the façades with unfavourable orientations or renaturalizing spaces inside the building itself, are also included. Likewise, this type of action is to be extended to other areas of the campus that can be landscaped with low water consumption species, such as xerophytes, which, in addition, support arid environments.
On the other hand, the energy rating maps of all UPV buildings have been published on the website of the Vice-Rectorate of Sustainable Development of the Campus for free consultation. These provide direct access to the energy qualification labels detailing the energy consumption (kWh/m2 year) and CO₂ emissions (Kg CO2/m2 year) for each building. It also specifies the calculation program and the effective date of the certificate. The following can be consulted here.
ENERGY TRANSITION: Adaptive reuse of UPV buildings
Silvia Domene Camarasa
Based on the bibliographic review and reference projects, the current state of the UPV buildings has been analyzed. This proposal has been approached in different phases. Firstly, from a management point of view, data on surface areas, uses, and mapping of the spaces have been collected. This information has been contrasted, processed, and combined with GIS methodology to obtain a graphic viewer that gathers information about each element to manage the areas described. These visors identify, on the one hand, the different teaching spaces and, on the other hand, the offices existing in the UPV, showing the occupancy and use data of all the various regions. This document has been published openly on the website of the Vice-Rectorate of Sustainable Development of the Campus.
Secondly, the adaptive reuse of buildings has been investigated using a literature review, the analysis of references, and the collection of key indicators. Through a comparative study of three European projects that reuse buildings to adapt them to higher education uses, it is proposed that strategies be extracted to design effective, adapted, comfortable, and efficient learning places.
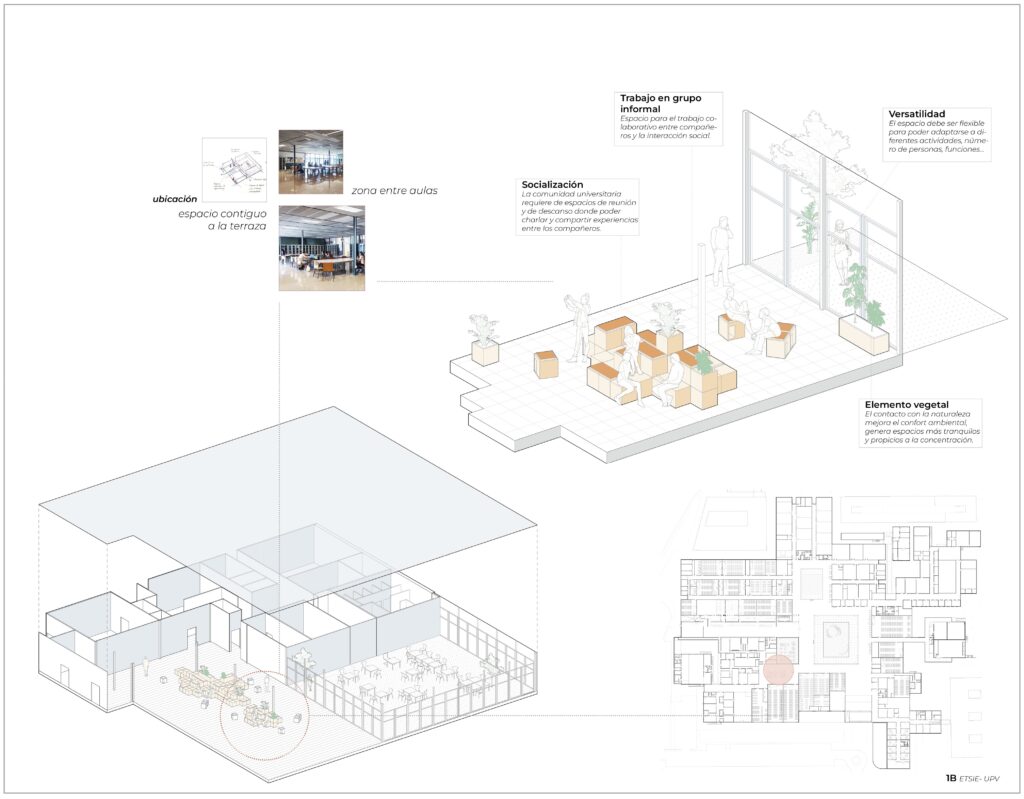
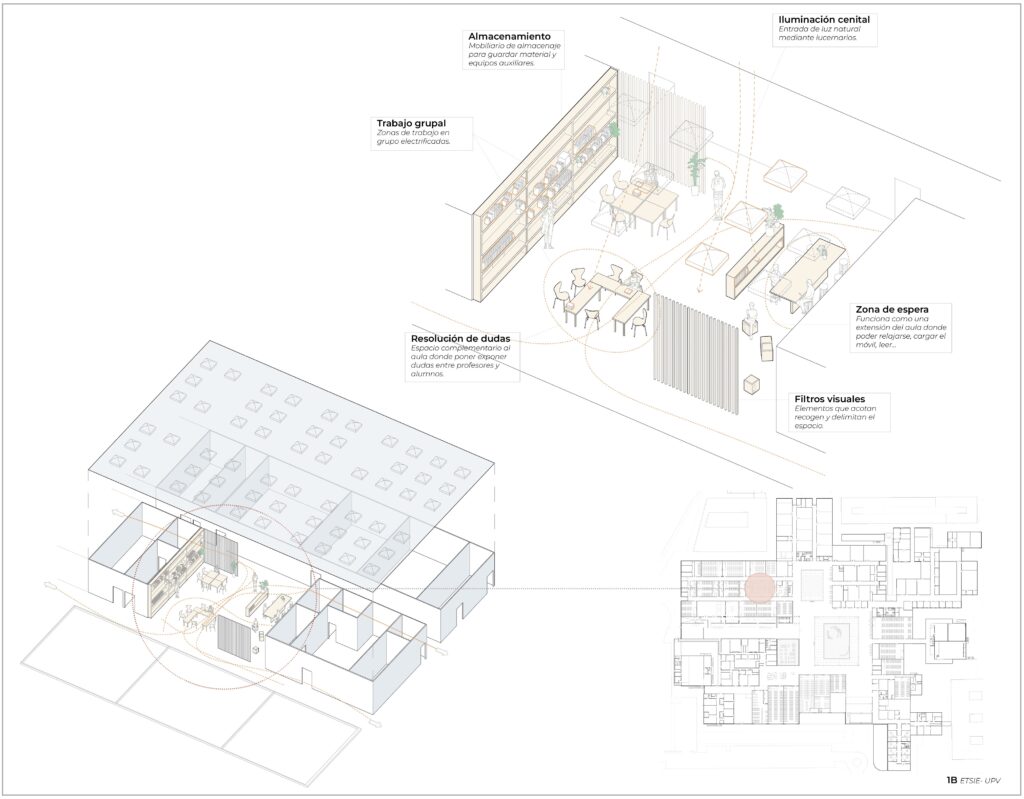
To apply this theoretical approach to the case of the UPV, several buildings of the Vera campus (1B and 3H) have been selected as case studies to be examined in depth through functional, efficiency, comfort and quality indicators. In these cases, strategies are proposed that are oriented to optimized space management, pursue greater flexibility and coexistence of uses, and aim to adapt the classrooms and rooms to the new requirements and ways of working. Specifically, the first case study, corresponding to 1B ETSIE, has been evaluated. For this purpose, we have analyzed the use ranges, circulations, needs and existing gaps. It should be noted that an absence of group work rooms, a lack of socializing areas and an incipient use of circulation spaces for other activities have been identified. As a result of the research, a series of actions are proposed that address the dynamization of spaces and their optimal use. For example, the introduction of furniture, the adaptation of circulation spaces suitable for social and collaborative uses, and the redesign, renovation and opening of underutilized teaching rooms as meeting and group workplaces.
At the same time, during this year of work, different training activities have been carried out, such as complementary courses, conferences and seminars. Transversal activities related to research, energy rehabilitation and sustainable design.
ECOLOGICAL TRANSITION: Improvement of the green infrastructure and biodiversity of the UPV
Rosalía García García
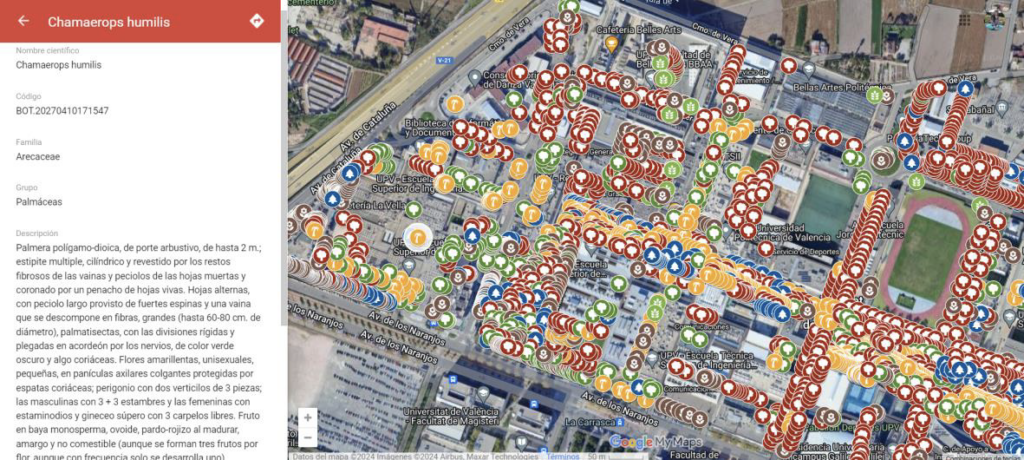
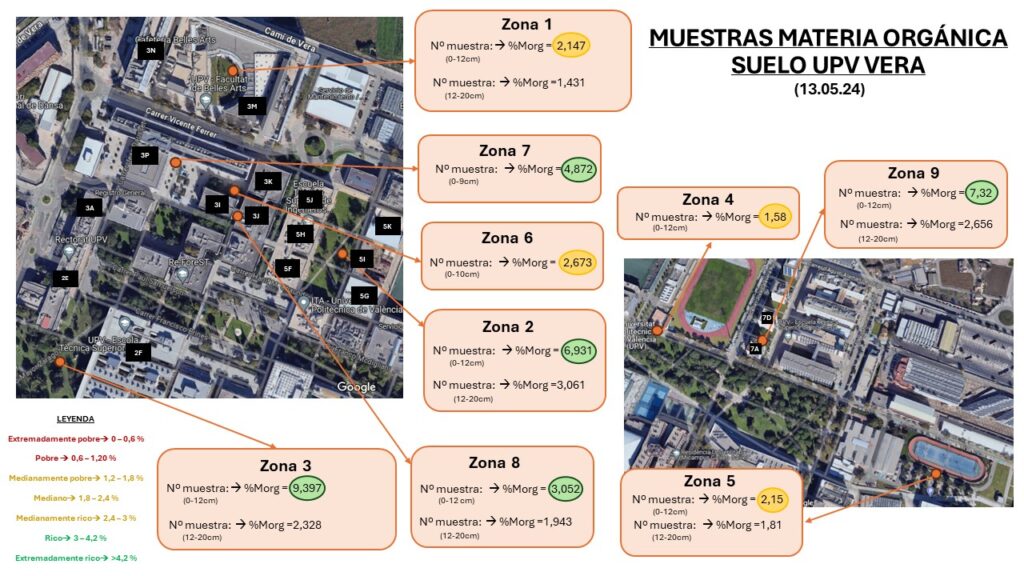
The main task carried out has been contextualizing the green infrastructure of the UPV in the three campuses. For this purpose, a revision of the botanical catalogue has been carried out. At the same time, it was introduced in the Environmental Management System (Oberón) database to computerize this information and make it publicly available. It will continue to be updated annually as the vegetation changes, but having it computerized facilitates communication with the people in charge of campus gardening and its updating. Another task carried out to contextualize the green infrastructure of the campus was the realization of two soil samples to determine the organic matter present (using the Walkey-Black method). Between all two samples, different zones of the Vera campus were selected according to the type of vegetation they had;
For the second main task, the improvement of biodiversity, a first draft of the technical specifications for the elaboration of the Green and Biodiversity Plan of the UPV was carried out; the methodology to be followed to carry out inventories of entomofauna is also being prepared, and actions have also been proposed, such as the sowing of flowering plants in brooms or grass areas, because they act as attractors for beneficial fauna (natural enemies, pollinators ….).
For both tasks, we looked for places to improve thermal comfort; for this reason, it was necessary to learn how to use a computer program (ENVI-met) to perform climate simulations in urban areas with vegetation and buildings. These simulations aim to select the hottest areas, measure the temperature variation during a day in a particular area, and evaluate the change in thermal comfort with a more significant presence of vegetation.
Results obtained
Regarding contextualizing the green infrastructure, the botanical catalogue of the three campuses (Alcoi, Gandia and Vera) is already published (Image 1), although it will continue to be reviewed periodically. Regarding actions to increase green infrastructure and biodiversity, these have not yet been carried out, although they are currently being planned.
Regarding the organic matter analysis, the results have allowed us to characterize the organic carbon content of the soil in the different areas of the campus, showing that, in general, the soils of the green areas have a medium-rich percentage of organic matter (1.5% – >4%) in the first 12 centimetres of the soil. Image 2 shows the results of some of the areas analyzed.
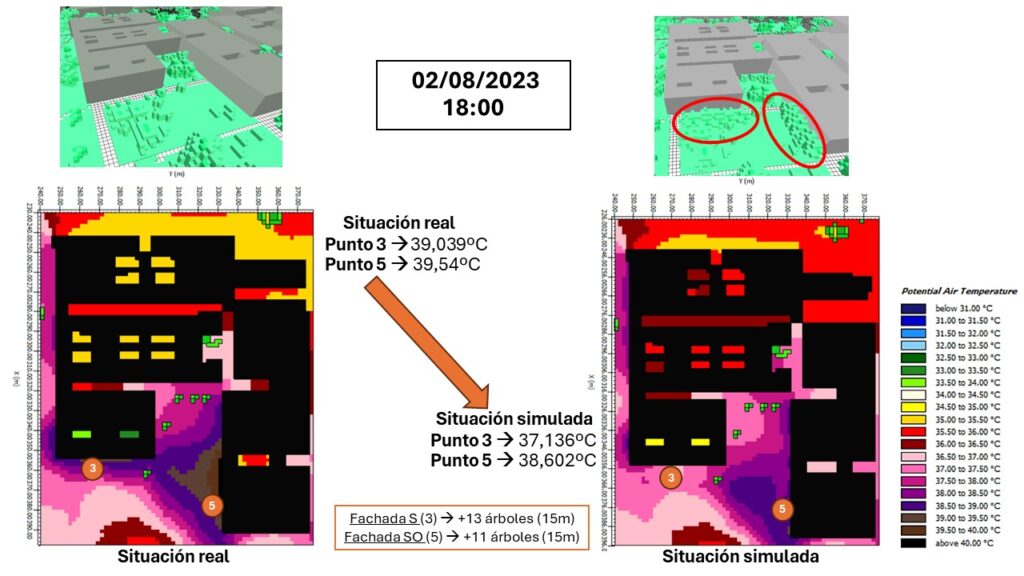
Finally, as regards the simulations carried out with ENVI-met, one was carried out in the ETSA building since the S and SOTA façades are very hot in the summer, as from midday, the sun shines directly on these areas of the building. In this simulation, 13 trees were added in the south façade (S) and 11 in the southwest façade (SOTA); two tests were carried out, one in which the trees measured 5 meters and another in which they measured 15 meters. In the first one, there were no significant changes, but in the second one, there was a decrease of almost 2 °C in the S façade and 1 °C in the SOTA façade (Image 3). These results demonstrate the program’s capability to plan the implementation of green infrastructure on campus to increase the climatic comfort of the campus.
ECOLOGICAL TRANSITION: UPV Carbon Footprint
Carles Úbeda Lloris
During this first year, the following objectives were achieved:
Scope 3 carbon footprint methodology
Alongside the Environmental Unit (UMA) of the UPV, the methodology for calculating the carbon footprint of the three campuses of the UPV (Alcoi, Gandia and Vera) was developed. To elaborate this methodology, the dimensions of the study and the variables to be used to calculate the scope 3 were first established: mobility, water consumption, waste management and procurement of goods and services;
The methodology was developed based on the data available for each variable and the characteristics of each university campus, resulting in a method for calculating the carbon footprint specific to the UPV.
After drafting the methodology, we proceeded to collect and compile the data necessary to calculate the carbon footprint for Abstraction 3 and obtain the results for 2022.
Reduction and compensation projects
Obtaining the results of the 2022 supplies 1, 2 and 3, as well as the values of the carbon footprint of previous years, has allowed us to begin to study measures for the reduction and take action to offset the UPV’s carbon footprint.
The UPV has compensated by 2022 a total of 6 T of CO2, planting 234 trees and reforesting approximately 25 to 30 hectares. With this, the university has obtained the MITECO “Compense” seal, awarded to organizations that compensate 1 ton of CO2.
Carbon footprint website
After calculating the carbon footprint from 2014 to 2022, we worked with the UMA to develop the carbon footprint website, which has already been published.
The website’s objective is to inform, raise awareness and make the UPV university community, as well as other universities or entities unfamiliar with the subject, aware of the carbon footprint.
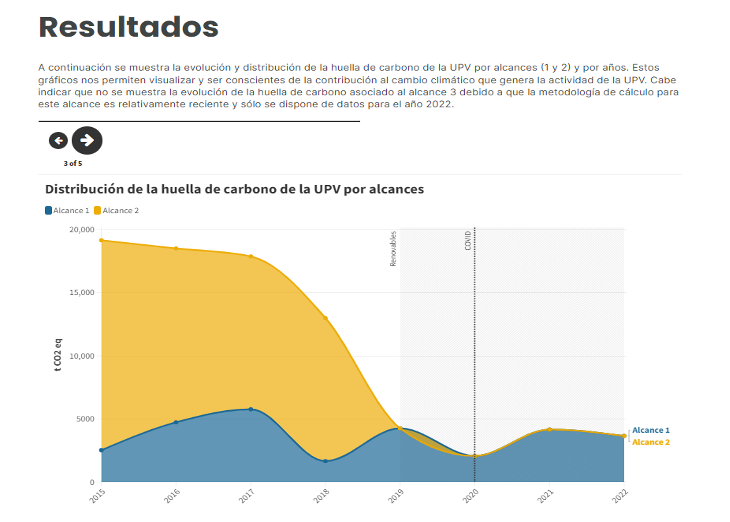
This web page explains carbon footprint and how it has been calculated and evolved at the UPV. The evolution of the carbon footprint can be observed in absolute values at the UPV level and per campus and relative values per person to raise awareness of the university community about its carbon footprint.
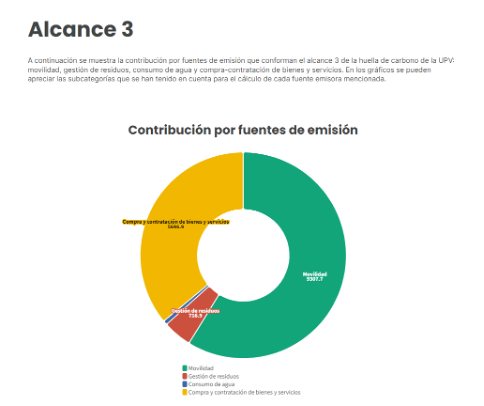
In addition to the main page showing the evolution of the carbon footprint, sections have been added where the annual values from 2019 to 2022 can be seen in more detail, and the reasons for these values are explained in summary. Below are a couple of graphs that can be found on the website. The first corresponds to the evolution of the carbon footprint in tons of CO2 equivalents from 2014 to 2022 for scopes 1 and 2, and the second to the contribution of the variables in scope 3 of the carbon stock—more information on the UPV’s carbon footprint here.